

A brief voltage drop can interrupt a process even when the supply quickly recovers. The impact of voltage sags on industrial equipment depends on how far voltage falls, how long it stays low, and how well connected controls, drives, and motors ride through the event. A voltage sag is a short-term RMS voltage drop below 90% of nominal; an interruption occurs when voltage falls to 10% of nominal or less.
That can make a disturbance easy to miss and its effects difficult to trace. If a PLC resets or a motor slows, the fault may seem to lie with the equipment or process, even when a supply-voltage dip was the trigger. Lightning is one possible cause, and recorded industrial cases show that lightning-related sags can coincide with equipment failures.
This article explains how to recognize voltage sags, distinguish them from micro-interruptions and other power-quality events, and assess their operational costs. It covers common causes, including lightning, and compares protection approaches such as ride-through measures, UPS systems, and energy storage. The aim is to help you connect power-quality evidence with equipment behavior and make an informed resilience decision.
Key Takeaways
- Assess a voltage sag by its depth and duration, then relate those characteristics to the equipment that resets, slows, or trips.
- Estimate downtime exposure using the cost per hour, average restart time, and frequency of disturbances.
- Distinguish a temporary voltage reduction from a micro-interruption or longer brownout to narrow down the right response.
- Match ride-through protection to the loads that need continuity; a UPS or motor-generator is not automatically the right fit for every power-quality issue.
- Use power-quality monitoring to identify disturbance patterns, including whether lightning may be contributing to equipment failures.
Economic costs of downtime and power-quality problems
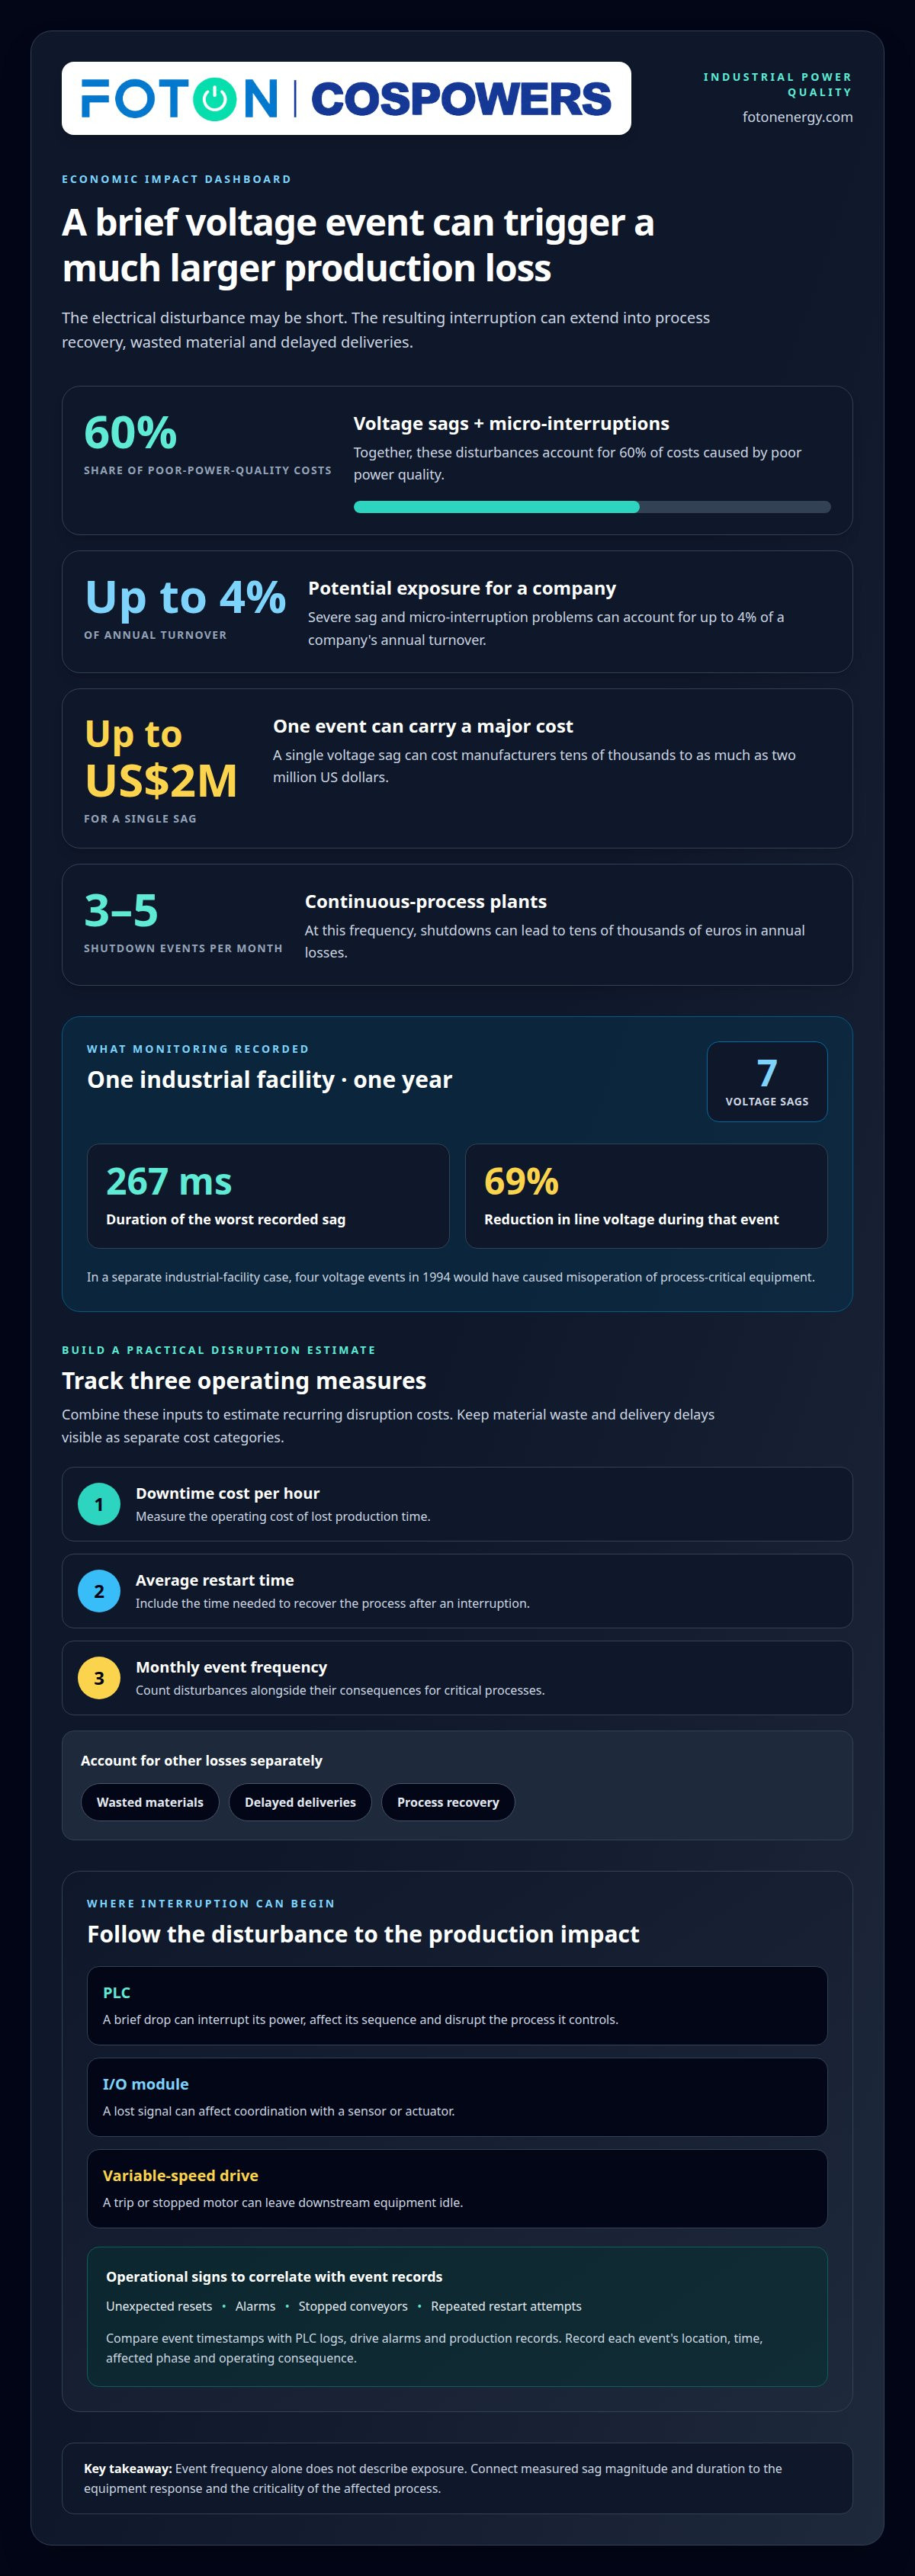
Power-quality disturbances can turn a short supply event into lost production, wasted material, and delayed deliveries. Voltage sags and micro-interruptions account for 60% of costs caused by poor power quality. Severe sag and micro-interruption problems can account for up to 4% of a company's annual turnover. The impact of voltage sags on industrial equipment can therefore extend beyond the electrical event, as a stopped line may need process recovery, material replacement, and schedule changes.
A single voltage sag can cost manufacturers tens of thousands to as much as two million US dollars. In continuous-process plants, 3-5 shutdown events per month can lead to tens of thousands of euros in annual losses. These figures illustrate why event frequency alone doesn't describe exposure. A disturbance affecting a critical process can carry different consequences from one affecting nonessential equipment, even when both appear similar on a meter.
Build a practical estimate using three operating measures: downtime cost per hour, average restart time, and monthly event frequency. Combine them to estimate recurring disruption costs, then account for wasted materials and delayed deliveries separately. For example, a production line that loses a batch during restart incurs both lost-time and material costs. Keeping these categories distinct helps operations teams compare disruption with potential improvements.
Equipment behavior can show where losses begin. A brief voltage drop may interrupt power to a programmable logic controller (PLC), affecting its sequence and the process it controls. An I/O module may lose a signal needed to coordinate a sensor or actuator. A variable-speed drive may trip or stop a motor, leaving downstream equipment idle. Symptoms can include unexpected resets, alarms, stopped conveyors, or repeated restart attempts.
Monitoring turns these operational signs into evidence. A one-year monitoring period at an industrial facility recorded seven voltage sags; the worst lasted 267 milliseconds and reduced line voltage by 69%. In the industrial-facility case, four voltage events in 1994 would have caused misoperation of process-critical equipment. Comparing event timestamps with PLC logs, drive alarms, and production records helps connect electrical disturbances to specific interruptions.
Power-quality analysis compares sag magnitude and duration with the affected equipment's response. Record the location, time, affected phase, and operating consequence for each event. In the United States, most electrical equipment is designed to operate at steady-state voltages within ±10% of nominal. Equipment tolerance and process sensitivity still vary, so measurements at the relevant bus or control supply provide more useful diagnostic evidence than a general facility-level reading.
Improvement starts with a measured cause and a defined critical load. Review PLC power supplies, I/O modules, and drive behavior against recorded disturbances, then prioritize equipment whose trip stops the process. IEEE Std 1668-2017 recommends voltage-sag test levels and methods for assessing equipment ride-through performance. Understanding the impact of voltage sags on industrial equipment helps guide control-circuit design choices and targeted protection, rather than treating every power-quality event as requiring the same solution.
UPS and motor-generator ride-through protection
Ride-through protection keeps selected loads operating during voltage drops, but each option serves a different purpose. Match protection to the critical circuits and the disturbances they need to withstand.
Motor-Starting Inrush and Voltage Dips
Motor-starting inrush is the brief, elevated current a motor draws as it accelerates from rest. Large motors can draw 6-10 times their normal operating current when starting. That demand can contribute to voltage dips across a shared distribution system, affecting sensitive equipment connected to the same supply. Staggering motor starts can reduce simultaneous demand, while reviewing the starting sequence helps identify whether startup coincides with control resets or drive trips.
Motor-Drive Ride-Through
Motor-drive voltage ride-through is a drive’s ability to keep operating during a temporary supply reduction. Configuring a drive system for ride-through can help a motor continue running through a sag instead of shutting down unnecessarily. The right response depends on the drive, motor, load, and disturbance. Review how the drive behaved during recorded voltage drops: did it trip, limit output, or continue operating? Then align its settings with process requirements.
Motor Stalling and Overheating
During a voltage sag, a motor can lose torque, slow down, or stop while drawing more current. The increased current raises winding heat and can degrade insulation over time. A stalled motor can also disrupt connected equipment, extending the interruption beyond the motor itself. Assess both the electrical response and the driven process: a pump, conveyor, or fan can have different operational consequences when its speed falls. Motor protection and restart behavior should reflect the load and the impact of interruption.
A UPS can switch to battery power when it detects an input-voltage drop, maintaining supply to selected loads. During deep sags, an uninterruptible power supply can bridge the disturbance and preserve the logic state of SCADA and PLC systems. This can be useful when control continuity matters, but battery backup is not the default answer to every power-quality issue. Match protection to the circuits that need continuity and the events they must ride through.
A monitored industrial facility identified a 13 kVA critical load for motor-generator backup and selected a 35 kVA set to serve it and allow future expansion. After installation, the set supplied that load for approximately 28 seconds after total power loss. The facility also had approximately 125 kVA of battery-backed UPS capacity installed. These figures describe one site’s arrangement, not a universal sizing formula.
Separate the loads that need immediate continuity from those that can stop and restart. Compare their operating demands, control requirements, and response to voltage drops before assigning UPS or motor-generator support. For broader resilience planning, consider site-level power continuity alongside equipment-level ride-through.
WHAT ARE VOLTAGE SAGS AND MICRO-INTERRUPTIONS AND HOW CAN THEY BE DISTINGUISHED?
A voltage sag is a short-term RMS voltage reduction, measured against nominal voltage over its duration; IEEE Std 1159-2009 defines its duration as the time RMS voltage remains below 90% until it rises above that threshold. Unlike a sag, an interruption falls to 10% of nominal voltage or below, a swell rises above 110% of rated voltage, and harmonics distort the waveform; a micro-interruption is a brief, complete voltage drop.
Voltage Sag Definition and Duration
An industrial voltage sag reduces RMS voltage to between 10% and 90% of nominal voltage, typically lasting from half a cycle to a minute. Its duration matters because equipment can respond differently to a brief dip and a longer reduction. For example, IEEE Std 1159-2009’s 90% threshold gives a consistent point for identifying when a sag starts and ends.
Sag Magnitude-Duration Analysis
Magnitude-duration analysis compares the remaining voltage with the time it stays reduced. A 480 V system that drops 48 V reaches 432 V, or 90% of nominal voltage. A separate illustrated event reaches 46% of nominal voltage for 5.4 cycles, equivalent to 89.5 milliseconds. Plotting both measures helps reveal why events with similar durations can affect equipment differently.
Use measured RMS voltage and event duration together rather than relying on a single minimum reading. A waveform capture shows the depth and timing of a disturbance, while a trend record helps compare events across production shifts. For example, if a drive trips during one measured sag but another event at a similar depth causes no interruption, investigate duration and equipment response more closely.
Distinguishing Power Disturbances
A voltage sag is a temporary reduction, while an interruption is a near-total loss of supply and a swell is a sudden increase. Micro-interruptions are complete voltage drops described as lasting 10 to 500 milliseconds. Harmonics differ because they alter the electrical waveform rather than describing a short-term drop or rise in RMS voltage.
Classifying the event correctly helps guide diagnosis. Compare voltage records at the affected equipment with measurements at the plant distribution point. If the timing and shape are similar at both locations, the disturbance may involve the wider supply. Utility transmission conditions can affect incoming power, while local records help show where the event becomes visible. This comparison helps distinguish a brief sag from recurring waveform distortion or a complete drop.
In practice, record event time, RMS voltage, duration, and affected equipment together. Then compare those records with drive alarms, control resets, or process interruptions. A measured sag lasting 89.5 milliseconds and reaching 46% of nominal voltage provides more diagnostic detail than a log entry that simply says “power fault.” That distinction helps engineers assess equipment ride-through against actual site conditions.
Causes and mitigation of voltage sags
Voltage sags can originate in the utility supply or within an industrial facility. Recorded causes include lightning and animal contact. Mitigation can include utility maintenance, targeted equipment protection, and dynamic voltage restorers, which inject voltage within milliseconds of detecting a sag.
Common Sources of Voltage Disturbances
External faults and events such as lightning can disturb supply voltage before it reaches plant equipment. Inside a facility, internal triggers account for nearly 80% of power-quality issues, making site-level analysis important alongside utility investigation. A disturbance that affects several circuits at once may point to an upstream event, while a problem limited to one load calls for closer inspection of that circuit.
Storm-related faults and contact by animals or vehicles can contribute to utility disturbances. Utilities can reduce some sags through equipment maintenance, tree trimming, and measures to limit access by animals and vehicles. Comparing plant monitoring records with the timing and distribution of affected loads helps distinguish an incoming event from a local production issue.
Equipment for Sag Mitigation
A dynamic voltage restorer (DVR) injects voltage into the system within milliseconds of detecting a sag, helping maintain supply to protected loads. Its role differs from a UPS, which can switch to battery power after detecting an input-voltage drop. The right equipment depends on which circuits need continuity and on the characteristics of the measured disturbance.
For control systems, AC- or DC-based controls compliant with IEEE 1668 or SEMI F47 can support voltage-sag robustness. Equipment designed and tested to IEEE Std 1668-2017 should withstand sags at or above the SEMI F47 curve’s bold black line. These references help frame equipment performance; they don’t replace selecting protection for the site’s power-quality environment.
Mitigation Strategies
Mitigation requires coordinating source-side measures, equipment design, and load protection. Start by matching monitoring records to the affected production circuits, then determine whether the disturbance comes from the utility supply or an internal trigger. This sequence helps prevent a broad equipment upgrade from becoming the first response when maintenance or targeted circuit protection may address the cause.
At the facility boundary, share event timing and monitoring evidence with the utility when patterns point to an incoming disturbance. Utility maintenance, tree trimming, and limiting animal or vehicle access can reduce some external causes. Within the plant, avoid sensitive AC components in control circuits where possible, and configure motor-drive systems for voltage ride-through.
Base protection on measured power quality, not a one-size-fits-all assumption. Compare sag depth, duration, affected loads, and production consequences before selecting a DVR, UPS, or control-circuit improvement. If one process line stops while other circuits remain stable, targeted protection may be more appropriate than covering the entire facility. After making changes, review monitoring records to see whether disturbances or equipment responses have shifted.
Lightning-related voltage sags and equipment failures
Lightning can trigger voltage sags that disrupt industrial equipment, even when a strike occurs away from the plant. At one monitored industrial facility, lightning caused six of the seven voltage sags recorded during a one-year monitoring period. Five of those six lightning-related sags resulted in equipment failures, linking storm-related disturbances with real operational consequences at that site.
These figures describe one facility, not a universal failure rate. They show why a storm-related event warrants investigation when production equipment trips or resets. A lightning strike can create an electrical fault on the supply network, and the resulting voltage reduction may reach plant circuits without causing a complete interruption. The effect depends on sag magnitude, duration, and equipment response.
Start by comparing monitoring records with equipment alarms, process logs, and storm-related outages. If a drive trip or PLC reset coincides with a measured sag during a lightning event, the link is more credible than a fault code alone. Record the affected circuit, the event’s magnitude and duration, and whether other equipment was interrupted at the same time.
Patterns across the facility can help locate the problem. If several production areas report disturbances together, investigate shared supply paths and incoming electrical records. If only one machine fails while neighboring circuits remain stable, focus analysis on that machine’s control supply and response. A monitoring project at the cited facility used 10 power-quality monitors, illustrating how multiple measurement points can capture events across different parts of an industrial system.
Lightning protection and voltage-sag mitigation address different aspects of risk. Utility maintenance, tree trimming, and limiting animal or vehicle access can reduce some external causes, but they do not eliminate lightning exposure. At the plant, monitoring helps establish which loads fail and under what conditions. Engineers can then match protection to critical circuits instead of treating every storm as evidence that all equipment needs identical backup.
After a storm-related failure, preserve event records before resetting alarms or clearing logs. Align timestamps across power monitors, PLCs, motor drives, and production systems. Compare repeated events by magnitude, duration, affected equipment, and operational outcome. If failures cluster around particular circuits, prioritize those loads for ride-through assessment. If several circuits respond differently to similar events, equipment sensitivity may be as important as the incoming disturbance.
The practical takeaway is clear: lightning-related voltage sags can be associated with equipment failures, but the monitored case’s numbers should not be applied as a forecast for every plant. Use site measurements and operating records to establish the local pattern. To explore broader resilience options, review energy resilience options.
Foton Energy (Foton Pty Ltd)
Foton Energy (Foton Pty Ltd) helps organizations consider energy storage and backup options as part of broader resilience planning. Once monitoring identifies vulnerable loads and continuity priorities, storage can form part of the response alongside equipment-level protection. Foton Energy offers C&I BESS, Utility-Scale Storage, Data Centre & Telco Backup, and Residential Storage Systems. The appropriate option depends on the site, the loads requiring support, and how interruptions affect operations. Storage should be assessed in context: it does not automatically replace targeted ride-through measures for sensitive controls or drives. If voltage disturbances have exposed continuity gaps at your site, contact Foton Energy (Foton Pty Ltd) to discuss your requirements.
Turn power-quality insight into a resilience plan
Addressing the impact of voltage sags on industrial equipment starts with a resilience plan built around the loads and operations that matter most. Monitoring records can show which circuits need ride-through, where backup capacity fits, and how energy storage could support broader continuity goals. The right approach connects electrical performance with operational priorities rather than treating storage as a substitute for every equipment-level measure.
Foton Energy (Foton Pty Ltd) offers C&I BESS, Residential Storage Systems, and Utility-Scale Storage. These solutions serve different energy-storage needs, from commercial and industrial sites to residential and utility-scale applications. Consider them within a broader assessment of your site’s needs and resilience objectives.
To discuss how energy storage may fit your requirements, contact Foton Energy. A clear view of your priorities is a practical starting point for building a more resilient energy system.
Frequently Asked Questions
How can I know whether my plant is subject to these disturbances?
Watch for repeated equipment trips, unexplained control resets, or process interruptions that coincide with electrical events. A power-quality monitor records voltage changes over time, while PLC and drive logs show how equipment responded. Compare timestamps across these records and production data. If faults cluster during storms or affect multiple production areas at once, the pattern can help distinguish an incoming supply disturbance from an isolated equipment problem.
How do voltage sags affect motors, drives, and contactors?
Motors can lose torque or slow, while drives may trip or change output as their supply voltage falls. AC pilot relays typically drop out at around 70% of nominal voltage, which can open a control circuit even if the motor itself could otherwise continue running. This may stop contactors and interrupt a sequence. Check drive fault records and relay behavior alongside motor operating conditions to identify the failure point.
How do voltage sags affect PLCs, robotics, and industrial control systems?
A sag can interrupt power to a PLC, causing a reset or loss of its programmed sequence. In a robotic cell, that reset may halt coordinated motion or interrupt communication between the controller and other equipment. Operators may need to re-establish the process state before production resumes. Review controller event logs, robot alarms, and the sequence active at the time to locate the affected control layer.
What sag depth and duration cause equipment trips or damage?
No single sag depth or duration applies to every industrial device. The response depends on the equipment’s voltage tolerance, internal power supply, operating load, and whether the sag begins at a waveform point that affects ride-through. Compare measured event magnitude and duration with the device’s documented performance and observed behavior. A trip indicates lost operation, while repeatedly elevated motor current can contribute to winding heat and insulation degradation.
What are the production, downtime, and financial costs of voltage sags?
Costs can include stopped production, scrapped material, restart labor, missed delivery schedules, and recovery checks. The impact varies by process: a brief interruption in a batch operation can waste product, while a stop in a continuous process may require coordinated restarts across connected equipment. Estimate exposure by relating event records to actual downtime, restart duration, affected output, and material loss. Separate direct production losses from later scheduling and recovery effects.
How can industries monitor and diagnose voltage sag events?
Use power-quality monitoring at points that represent the incoming supply and sensitive production circuits. Align each event’s timestamp, affected phases, magnitude, and duration with PLC, drive, and production-system logs. This helps determine whether several areas experienced the same disturbance or a single branch was affected. A waveform capture adds detail about voltage changes during the event, while operational records show which equipment stopped or changed state.
What standards and recommended voltage ride-through limits apply to industrial equipment?
IEEE Std 1668-2017 recommends test levels and methods for assessing equipment ride-through during supply-voltage reductions lasting less than one minute. SEMI F47 provides a voltage-sag curve used to assess equipment performance, and the IEEE 1668-2017 fact line references that curve. These standards inform testing, but equipment selection should also consider the site’s measured events and the specific loads requiring continuity.


