

A smoother solar profile is a control outcome, not simply a battery-size assumption. Smoothing solar intermittency with BESS means charging when PV generation rises above the desired output and discharging when it falls, while ramp-rate controls limit how quickly power delivered to the grid can change. Together, these actions shape a steadier output profile.
Cloud-driven swings in solar generation can affect grid frequency and voltage, so the control strategy matters as much as the stored energy. A battery can follow a target output using methods such as moving-average smoothing, or respond when measured power ramps exceed a set threshold. Each method affects how often the battery charges and discharges, and how much energy it must exchange.
This article explains how these operating decisions work in practice, including smoothing controls and the trade-offs between output stability and battery use. You’ll learn how ramp-rate limits shape PV output, how charging and discharging can support grid conditions, and why the right control approach depends on the plant’s operating needs.
Key Takeaways
- Choose charging and discharging controls around the PV output profile and the grid’s target, since smoothing methods can create different battery energy demands.
- Consider frequency and voltage together: sudden renewable-generation changes can affect both, while storage can respond to frequency deviations within milliseconds.
- Assess ramp rates by looking beyond averages. Short, sharp PV changes can matter even when the mean ramp rate is comparatively low.
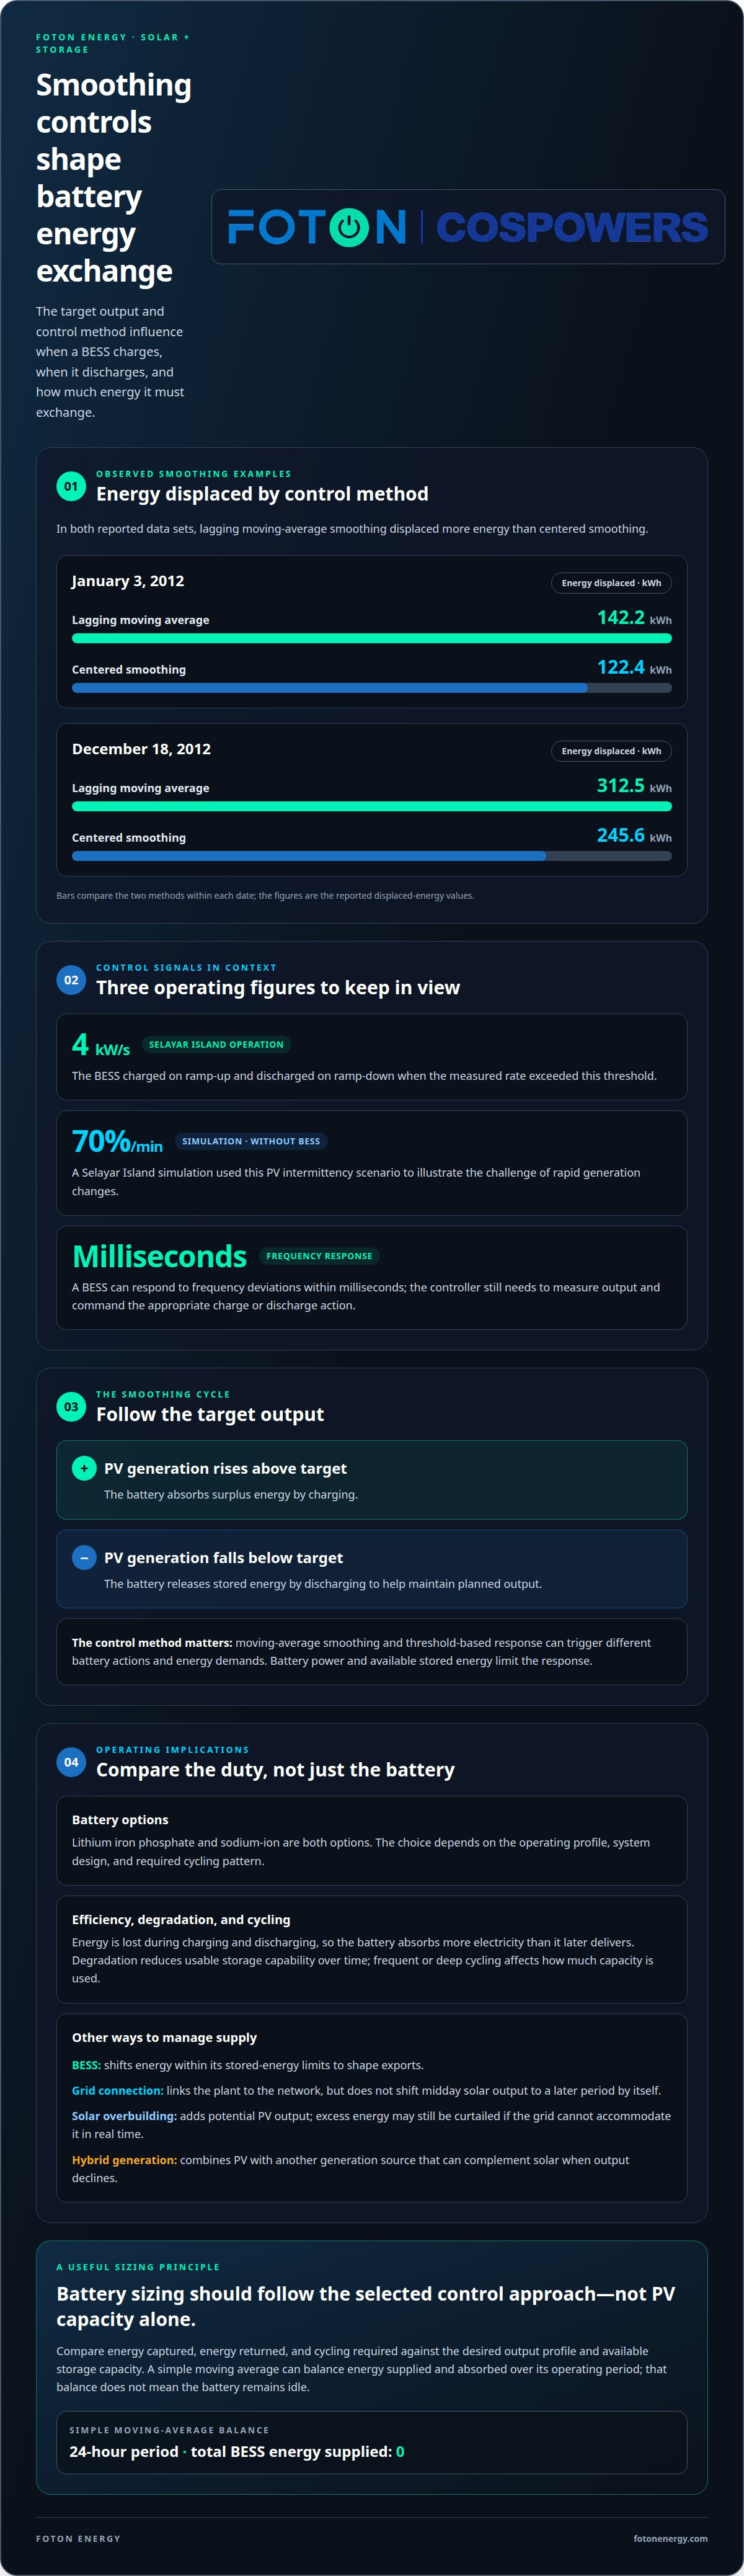
- Set ramp-rate thresholds to guide battery response; during Selayar Island smoothing operation, the BESS charged on ramp-up and discharged on ramp-down when the measured rate exceeded 4 kW/s.
- Compare observed battery energy exchange across control methods and time windows to understand how smoothing choices influence storage requirements.
Battery charging and discharging for PV smoothing
A BESS charges when PV generation exceeds its target output and discharges when generation falls below it. This shifts energy across changing solar conditions and helps create a steadier export profile. The control strategy determines when the battery acts and how much energy it exchanges.
Charging and Discharging Stored Energy
When generation exceeds the target, the battery absorbs energy. When PV output declines, it releases stored energy to help maintain the planned output. This is the core operating cycle for smoothing solar intermittency with BESS, though the battery’s power and available stored energy limit its response.
No single battery chemistry is best for every smoothing duty. Lithium iron phosphate and sodium-ion are both options; the choice depends on the operating profile, system design, and required cycling pattern. For example, a project handling frequent, short output changes may prioritize different operating characteristics from one managing longer declines in generation.
The control method influences how much energy the battery must exchange. In a January 3, 2012 data set, lagging moving-average smoothing displaced 142.2 kWh, compared with 122.4 kWh for centered smoothing. On December 18, 2012, the respective values were 312.5 kWh and 245.6 kWh.
These examples show why battery sizing should follow the selected control approach, not PV capacity alone. A simple moving average can balance energy supplied and absorbed over its operating period: the total energy supplied by the BESS over a 24-hour period is zero. That balance doesn’t mean the battery remains idle; it still charges and discharges as output changes.
Comparing Smoothing Approaches
BESS smoothing stores surplus PV for later discharge, while a grid connection carries electricity between the plant and the wider network. Solar overbuilding adds generation capacity, and hybrid generation combines PV with another generation source. For smoothing solar intermittency with BESS, the value is in shaping exports through controlled energy storage, rather than simply increasing PV output.
A grid connection alone doesn’t shift midday solar output to a later period; a battery can shift energy, within its stored-energy limits. Overbuilding can increase potential PV output, but excess energy may still be curtailed if the grid cannot accommodate it in real time. Hybrid generation can complement solar when PV output declines.
Efficiency, Degradation, and Cycling Economics
Battery efficiency describes how much stored energy is returned after charging and discharging. Because energy is lost in the process, the battery must absorb more electricity than it later delivers. Degradation reduces usable storage capability over time, while frequent or deep cycling affects how much of the battery’s capacity is used.
For an economic assessment, compare the energy captured, energy returned, and cycling required by each control method. A strategy that follows every brief PV fluctuation may require more frequent battery action than one that filters short changes. Compare those operating demands with the desired output profile and available storage capacity.
Grid frequency and voltage impacts of PV intermittency
Weather-driven changes in solar and wind output can shift electricity supply quickly. A BESS can respond to frequency deviations within milliseconds and help maintain stable voltage.
In the United States, interconnection and grid-code requirements depend on the project, its connection point, and the relevant utility or grid-operator rules. The interconnection process establishes how the PV plant, battery, inverters, protection systems, and controls must operate together.
Frequency reflects the balance between electricity supply and demand across a power system. If PV output drops suddenly, available generation falls while demand remains unchanged; if output rises sharply, supply can increase faster than demand. Either shift can contribute to a frequency imbalance. A battery can absorb power during excess generation or discharge when generation declines, helping balance conditions at its point of connection.
Voltage is more local. It can change as generation and demand shift across a network, particularly where power flows through constrained infrastructure. Storage controls can adjust charging and discharging to support steadier power delivery. The result depends on the system configuration and coordination with the grid connection.
This distinction matters in operation. A frequency response addresses a system-wide imbalance, while voltage support concerns conditions at a specific network location. A single PV fluctuation can affect both, but not necessarily in the same way. Battery controls must follow their operating objective rather than treating every grid deviation as identical.
A Selayar Island simulation examined PV intermittency at 70%/min without BESS. That scenario illustrates the challenge of rapid generation changes: PV output can move faster than other grid resources can adjust. Storage can respond quickly, but its control system still needs to measure output, compare it with a target or grid signal, and command the appropriate charge or discharge response.
For grid stabilization, effective coordination links PV output, the battery’s operating limits, and the connection requirements. If the controller prioritizes smoothing, it can moderate rapid changes in delivered PV power. If it responds to frequency or voltage signals, it can direct battery power toward the relevant grid condition. Clear operating priorities help prevent conflicting commands.
Interconnection planning should account for the combined system, not PV or storage in isolation. The project design needs to align inverter behavior, control settings, protection, and export targets with applicable connection requirements. This coordination defines the response to changes in solar output and clarifies how storage contributes to frequency and voltage stability.
Solar and wind generation depend on weather, which can cause fluctuations in electricity supply. Sudden increases or drops in renewable generation can contribute to grid voltage and frequency imbalances.
Solar PV power ramp-rate analysis
A PV ramp rate measures how quickly plant output rises or falls over time. For BESS planning, it shows the speed and magnitude of changes the control system must manage.
Mean and peak ramp rates tell different stories. In the January 3, 2012 data set, raw PV output had a mean ramp rate of 0.50 kW/s and a maximum of 10.19 kW/s. On February 11, 2013, the mean was 2.75 kW/s, while the maximum reached 47.28 kW/s. A low average can therefore coexist with sharp short-lived swings.
The December 18, 2012 data set shows the same distinction: its mean raw ramp rate was 1.22 kW/s, but its maximum reached 87.10 kW/s. Designing around the mean alone could miss the fast events that drive ramp-rate control. A useful assessment compares raw output with smoothed output, then checks both average behavior and high-percentile or maximum changes.
For January 3, 2012, modeled smoothing produced 99th-percentile ramp rates of 4.00 kW/s with a lagging moving average and 4.04 kW/s with a centered moving average. These figures are not universal thresholds; they describe the selected data and modeled controls. They show how a control method can reduce abrupt output changes, while its window and response characteristics shape the result.
AI and predictive analytics can add a forward-looking layer to this analysis. A forecasting model can use PV output history and incoming generation measurements to estimate an approaching change. The controller can then schedule charging before a predicted rise or preserve discharge capability ahead of a decline. Forecasts complement measured ramp rates; the live output signal still shows what the plant is delivering.
Battery energy exchange also varies by smoothing design. In simulations for a 5 MWp plant, simple moving-average smoothing required up to 600 kWh with a 30-minute window and 1,200 kWh with a 60-minute window. Single- and half-window smoothing required 200 kWh and 300 kWh, respectively. These results make the window length and control technique central inputs to sizing.
In the United States, available solar-plus-storage incentives and tax credits depend on applicable federal, state, and local programs and project eligibility. Ownership, system configuration, and location are relevant when assessing which provisions apply.
A practical ramp-rate assessment compares plant output, control targets, and battery exchange across representative operating periods. Include clear-sky rises and rapid drops, then evaluate how the chosen method handles each event. This connects observed PV behavior to the control strategy and storage design, rather than treating one average ramp-rate figure as the entire operating requirement.
BESS ramp-rate control threshold
A ramp-rate threshold tells the BESS when PV output is changing too quickly. At Selayar Island, the battery charged during ramp-up and discharged during ramp-down when the measured power ramp rate exceeded 4 kW/s.
The threshold is a trigger, not a complete sizing rule. When measured PV change crosses it, the controller can command battery power in the opposite direction to moderate the change seen at the grid connection. Below the trigger, the system can follow its normal operating target. This ties the response to observed plant behavior.
The required BESS power and energy capacity depend on different needs. Power capacity determines how strongly the battery can counter a rapid output change; energy capacity determines how long it can sustain that response. For a 5 MWp solar plant, typical BESS energy sizing for smoothing is described as 200-300 kWh, but the control method and PV profile affect the requirement.
Operators dispatch the battery through a control system that measures PV output, calculates its ramp rate, compares that rate with the threshold, and issues a charge or discharge command. The controller also needs to account for the target export profile and available stored energy. A threshold-triggered response works only while the battery has enough power and energy to follow the command.
Threshold selection shapes the balance between smoother export and battery activity. A lower trigger can prompt responses to smaller output changes, while a higher trigger allows more variation before intervention. The appropriate setting depends on the connection’s ramp limits, the solar plant’s observed fluctuations, and the intended output profile. Selayar Island’s 4 kW/s example is a case-specific operating threshold, not a universal setting.
Energy compensation can refine dispatch by tracking the difference between target and actual output over time. One proposed method monitors that energy difference over a 20-minute period, helping balance earlier charging or discharging against later plant output. This is distinct from the immediate ramp-rate trigger: one manages rapid changes, while the other addresses accumulated energy deviation.
Model defaults provide useful context, not a project specification. One model uses a 1 MW PV plant and a 90 kWh battery, illustrating that capacity assumptions belong to a particular simulation. For a real operating profile, evaluate threshold response alongside battery power, available energy, and the duration of ramp events. That separates the instantaneous response requirement from the energy needed to sustain it.
The model uses moving-average control with a battery energy storage system to smooth intermittent PV plant output power. For the January 3, 2012 data set, the modeled lagging moving-average algorithm had a mean ramp rate of 508.62 W/s, and the modeled centered moving-average algorithm had a mean ramp rate of 513.29 W/s. The modeled low-pass filter algorithm had a mean ramp rate of 508.20 W/s.
Separately, a 20%/min PV power ramp-down rate was simulated for the Selayar grid without BESS. This no-BESS case provides a comparison for considering storage’s role in ramp smoothing. The modeled algorithm results describe ramp rates under those specific data and control conditions; they are useful for comparing approaches, but do not establish a universal operating threshold.
Observed BESS smoothing operation
Observed operation shows how the control method affects battery energy exchange, not just the PV output profile. For a 5 MWp solar plant, energy-compensated single- and half-window smoothing required a maximum exchange of 200 kWh with a 30-minute window, and 250 kWh with a 60-minute window.
The larger window did not simply double the exchange in this example. Instead, it increased the maximum from 200 kWh to 250 kWh. That difference illustrates why operating results need to be read alongside the selected algorithm and measurement period. Window length alone doesn’t describe the battery’s full response.
Energy compensation tracks the gap between target output and actual PV generation over time. If the battery charges during an earlier surplus, the controller can account for that stored energy when output later falls. This helps explain how a system can moderate short-term changes while managing energy exchange over a longer operating interval.
For comparison, simple moving-average smoothing in a 5 MWp plant simulation required a maximum BESS energy exchange of 600 kWh with a 30-minute window and 1,200 kWh with a 60-minute window. The energy-compensated figures above are smaller, but they describe a different smoothing technique. They shouldn’t be treated as interchangeable project specifications.
The cost of a BESS for solar smoothing in the United States depends on the project and is provided after a quote request; key factors include power and energy capacity, duration, controls, interconnection, and installation scope.
Safety, fire, and operational risks need assessment across the battery, PV system, and grid interface. Key concerns include electrical faults, battery fire, incorrect isolation, and control or communications failures that prevent the intended response. Operating limits matter too: if stored energy or available power cannot meet a dispatch command, the system may not deliver the planned smoothing response.
Good operating practice connects monitoring, control logic, and response procedures. The system needs clear charging and discharging limits, reliable PV output measurements, and defined actions for unexpected equipment or communications behavior. For example, a controller should not treat missing measurements as evidence that PV output is stable. Operating procedures should also specify how the battery returns to normal service after an interruption.
The practical takeaway is to compare observed energy exchange under the intended control method, then align operating limits and safety procedures with that result. A 30-minute window and a 60-minute window produced different exchanges in the energy-compensated example. Discuss a BESS smoothing design around your PV profile, operating targets, and grid connection.
Foton Energy (Foton Pty Ltd): C&I BESS
Foton Energy (Foton Pty Ltd) offers C&I BESS for commercial and industrial projects assessing solar smoothing. It’s a natural next step when PV ramp-rate analysis shows that output changes need to be managed through coordinated battery charging and discharging.
Apply the operating findings to the project’s generation profile, export target, and grid connection. These factors shape how a BESS fits the site’s requirements and what the system needs to support its intended role. Foton Energy also offers Residential Storage Systems and Utility-Scale Storage for projects at different scales, plus Data Centre & Telco Backup for backup applications.
For a commercial or industrial project focused on solar smoothing, contact Foton Energy (Foton Pty Ltd) to discuss your requirements.
Turn the smoothing strategy into a project decision
The next step is to define what a stable PV output means for your project. Set the export objective, identify the grid conditions the system must address, and align battery dispatch with the plant’s operating priorities. This turns smoothing solar intermittency with BESS from a control concept into a design brief that can guide engineering decisions.
Bring the operating profile, connection requirements, and intended battery role into the same discussion. A coordinated view helps clarify the most important control objectives and how storage should fit the wider energy system. It also gives project stakeholders a shared basis for assessing system design and integration needs.
Foton Energy (Foton Pty Ltd) offers energy storage solutions for commercial, residential, and utility-scale applications. If you’re developing a project and want to discuss how battery storage could support its operating objectives, contact Foton Energy (Foton Pty Ltd). A clear project brief is a practical place to begin, and a well-aligned design can move your solar strategy forward with confidence.
Frequently Asked Questions
How are solar ramps and intermittency measured for battery sizing?
Measure PV output over time, then calculate each ramp by dividing the change in power by the elapsed time. For sizing, review the ramp profile alongside the cumulative difference between actual generation and target output. The ramp rate informs the battery’s required power response, while the accumulated energy difference informs its energy capacity. Include different operating conditions, such as cloud-driven drops and clear-sky increases, in the assessment.
What battery chemistries are best for solar smoothing?
No single battery chemistry is best for every solar-smoothing duty. Lithium iron phosphate and sodium-ion are both options; the choice depends on the operating profile, system design, and required cycling pattern.


