

A battery’s headline savings aren’t its ROI. For calculating ROI for commercial battery storage, subtract net system cost from total savings over the system’s lifespan, divide by net system cost, then multiply by 100; for simple payback, divide total capital investment by annual net savings. The result depends on how the battery interacts with your facility’s load, tariffs and operating costs.
It’s sensible to look beyond projected savings and ask what data and assumptions support them. A useful assessment starts with at least 12 months of utility bills, interval-meter data and operating schedules, then accounts for potential value from demand-charge reduction, energy shifting and other applicable revenue streams.
This guide explains which energy data to gather, how to estimate annual savings, and which system costs and performance factors to include. You’ll also learn how to compare payback with lifetime ROI, so your decision reflects the project’s economics rather than a single attractive number.
Key Takeaways
- Separate simple payback from lifetime ROI: one estimates how quickly the investment is recovered, while the other weighs costs and returns across the system’s operating life.
- Build your baseline from a full year of utility bills, interval-meter data, and operating schedules to reveal when and how your facility uses energy.
- Assess demand-charge savings against the tariff’s billing interval, since battery dispatch must target the peaks that drive your bill.
- Include installation, operating, maintenance, and replacement costs, and account for changing battery performance over time.
- Model savings and revenue streams together, then compare projected cash flow across the system’s lifespan before making an investment decision.
What Impacts ROI in Battery Energy Storage?
A battery can shift energy and reduce peak demand. Solar-plus-storage can also retain more onsite solar generation, while generators primarily provide backup power. Include each option’s distinct bill savings, revenue, operating costs, and resilience value instead of comparing equipment on purchase cost alone. An ROI model should account for utility tariffs, dispatch assumptions, round-trip efficiency, battery degradation, operating costs, and changes in savings over time.
-
Select the ROI and Payback Formulas
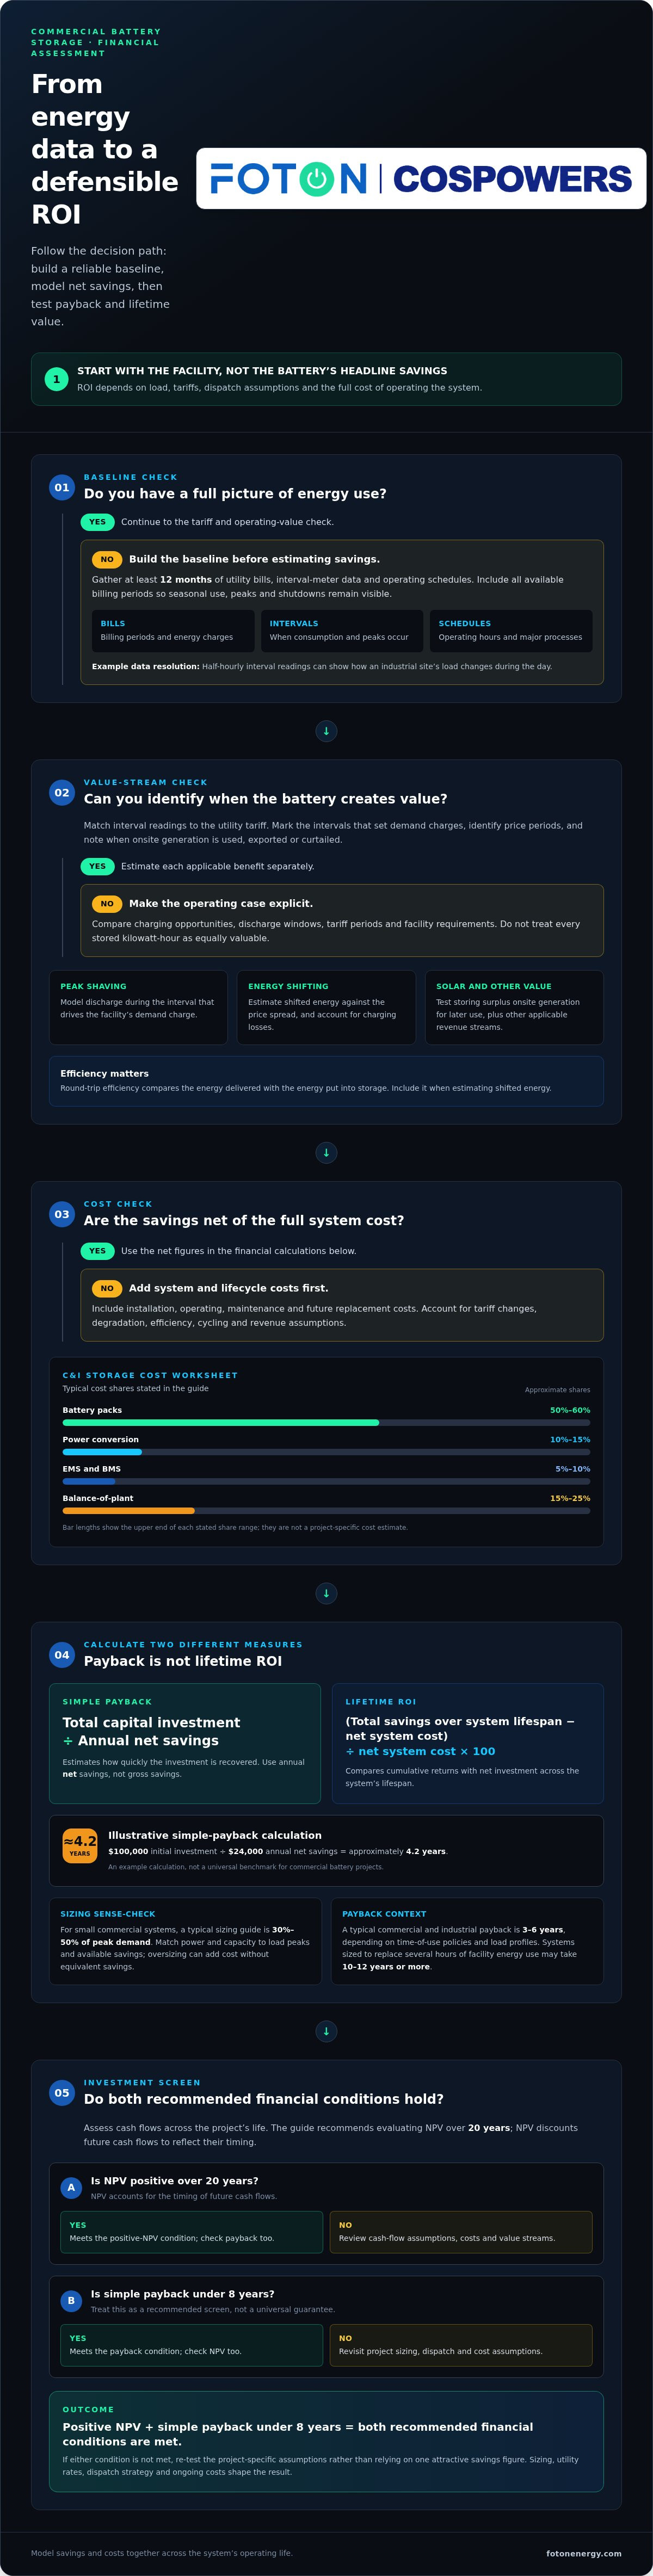
Calculate simple payback by dividing total capital investment by annual net savings. Then calculate lifetime ROI: subtract net system cost from total savings over the system lifespan, divide by net system cost, and multiply by 100. Keep the measures separate: payback estimates the recovery period, while ROI compares cumulative returns with net investment. Avoid counting gross savings as net savings.
-
Size the Battery and Estimate Payback
Match battery power and capacity to the facility’s load peaks and available savings opportunities. An oversized system can add capital cost without creating equivalent additional savings; a system that is too small may miss valuable peak reduction. For small commercial systems, a typical sizing guide is 30-50% of peak demand. Use modeled annual net savings to estimate payback, not the battery’s capacity alone.
-
Compare Simple Payback and Net Present Value
Use simple payback for a quick screening calculation, then assess cash flows across the project’s life. A commercial example with $100,000 initial investment and $24,000 annual net savings has an approximate 4.2-year simple payback. Net present value discounts future cash flows to reflect their timing. Evaluate it over 20 years; positive NPV is one recommended condition for financial viability, alongside simple payback under 8 years.
-
Account for Use Cases, Risks, and Assumptions
Model the use case that drives value, such as peak shaving, energy shifting, or backup support. A typical commercial and industrial payback period is 3-6 years, depending on local time-of-use policies and facility load profiles; systems sized to replace several hours of facility energy use may take 10 to 12 years or more. Test how tariff changes, degradation, efficiency, cycling, maintenance, and revenue assumptions affect annual net savings.
Compare the modeled result with your project’s operating priorities. A five-year payback example is not a universal benchmark: system sizing, utility rates, dispatch strategy, and ongoing costs determine whether a particular facility achieves a similar payback period.
Gathering baseline energy and interval-meter data
Build a time-based picture of consumption before estimating storage value. A reliable baseline combines utility bills, interval readings, operating schedules, and onsite generation across changing seasons.
- Collect at least 12 months of utility bills, interval-meter data, and operating schedules. Include every available billing period so seasonal production, demand peaks, and facility shutdowns remain visible. Half-hourly interval data can reveal how an industrial site’s load changes during the day. Match readings to tariff periods and note when backup equipment or major processes operate.
- Compare interval readings with the utility tariff. Record energy prices by time period, demand charges, and any relevant export compensation. Mark the facility’s highest-consumption intervals, then compare them with lower-price periods. For energy arbitrage, estimate shifted kilowatt-hours multiplied by the price spread. Account for charging losses too: round-trip efficiency compares the energy delivered with the energy put into storage.
- Measure renewable energy generation against onsite use. Separate solar generation consumed immediately from energy exported or curtailed, then identify when a battery could store surplus for later consumption. One Spain light-commercial example uses a 10 kW solar array generating 14,000 kWh per year.
- Translate the interval profile into a clear operating case. Compare charging opportunities, discharge windows, and facility load requirements, and distinguish bill reduction from backup value. For renewable energy optimisation, test whether stored solar can meet later site demand without conflicting with peak-shaving needs. This schedule makes dispatch assumptions explicit rather than treating every stored kilowatt-hour as equally valuable.
- Build a capital-cost worksheet without relying on a single equipment figure. Commercial and industrial storage costs include battery packs, power conversion, energy and battery management systems, and balance-of-plant. Typical cost shares are approximately 50%-60% for battery packs, 10%-15% for power conversion, 5%-10% for EMS and BMS, and 15%-25% for balance-of-plant. Include operating and future replacement costs in the same model.
Use this baseline to shape a project-specific storage assessment, including commercial energy storage requirements and operating priorities.
Revenue Streams: How Does It "Make and Save" Money?
Estimate each value stream separately before combining annual benefits. Peak demand shaving, energy arbitrage, and grid participation each depend on different operating conditions and tariff rules.
-
Identify Peak Demand Shaving Savings
Find the peak interval that sets the facility’s demand charge, then model battery discharge during that period. Many commercial tariffs measure peak demand in 15-minute blocks, so dispatch must align with the billing interval. Demand charges can represent 30-70% of some commercial electricity bills. A battery that discharges outside the measured peak may shift energy without reducing the charge, so examine interval timing carefully.
Compare the recorded peak with the reduction the battery can achieve, allowing for other loads running at the same time. The value comes from avoided kilowatts multiplied by the applicable demand rate. Keep this separate from energy arbitrage: reducing a peak can lower a demand charge, while shifting kilowatt-hours targets consumption charges.
-
Separate Consumption Charges from Demand Charges
Separate the utility bill into energy consumption and peak demand charges. Consumption charges apply to kilowatt-hours used; demand charges apply to kilowatts measured during the tariff’s specified interval. A battery can charge when energy costs are lower and discharge during higher-price periods, creating arbitrage value. Estimate annual energy arbitrage by multiplying shifted kilowatt-hours by the price spread.
Use the actual tariff periods and billing rules in the model. A peak and off-peak spread above $0.20 per kWh is a favorable ROI scenario, but round-trip efficiency affects delivered energy. Avoid counting the same discharge as both full energy-arbitrage savings and full demand-charge savings unless both benefits genuinely appear on the bill.
-
Estimate Commercial Demand-Charge Reduction
Multiply avoided kilowatts by the demand rate, then by the applicable billing periods. In a Utah manufacturing example, a 50 kWh battery reduces a 150 kW peak by 35 kW. This demonstrates why battery capacity alone doesn’t determine value: the achievable peak reduction and tariff rate drive the calculation.
Compare the projected reduction with the facility’s full load profile and tariff. Demand charges above $15 per kW are among the more favorable conditions for battery ROI. Peak-demand-shaving systems can reduce demand charges by 20% to 40%, depending on the site and dispatch conditions. Model the relevant peak rather than assuming every monthly maximum can be lowered equally.
-
Include Demand Response and Grid Incentives
Include demand-response payments only if the operating model assumes participation and the facility can meet program dispatch requirements. Treat them as separate revenue inputs, not guaranteed savings or a substitute for tariff analysis.
Check how program dispatch interacts with the site’s peak periods, stored-energy needs, and cycle assumptions. A grid event may call for discharge when the facility also needs backup or demand reduction. Model event revenue alongside any resulting change in bill savings, then include only compatible value streams in the projected return.
Commercial battery system costs and annual savings
Include financing, installation, and operating costs when estimating payback. Financing terms affect cash flow; installation scope, maintenance, and eventual component replacement affect total project costs and annual savings.
-
Estimate Upfront and Installation Costs
Build a project-specific cost schedule that separates equipment from installation and commissioning. Include the battery, power conversion equipment, controls, electrical integration, site preparation, and connection work where required. These components determine the installed system’s capital requirement, so don’t treat the battery as the entire project. Before assessing return on investment, compare the proposed capacity with the facility’s actual operating needs.
Use a consistent scope when comparing system configurations. A 100 kW / 215 kWh commercial system, for example, describes both power and energy capacity; neither figure alone represents its total project cost or expected savings.
-
Account for Project Costs and System Architecture
Map the system architecture before forecasting costs. Identify battery capacity, inverter requirements, energy management controls, balance of plant, and the site infrastructure needed for integration. Each design choice affects how the system charges, discharges, and serves facility loads. A system designed for peak management may have different power and energy requirements from one intended to support longer-duration operations.
Treat scalability as a design choice, not an automatic saving. Adding capacity later can change integration needs and project scope. Keep equipment, installation, and financing assumptions separate so projected savings don’t obscure the investment needed to achieve them.
-
Estimate Annual Savings and System Performance
Project annual savings using the dispatch plan, then reduce future benefits to reflect battery degradation. A commercial model should account for changing capacity over time. For LiFePO4, estimated capacity is 85-90% of its original level in year 10. Lower available capacity can affect peak reduction, energy shifting, and the electricity savings those strategies deliver.
Include maintenance and replacement planning across the operating period. Energy storage systems can have a lifespan of 15 or more years, and eventual inverter or cell module replacement belongs in the model. These inputs help distinguish first-year savings from the return expected over the system’s full service life.
-
Include Financing, Installation, and Operating Costs
Enter financing, installation, routine operation, maintenance, and planned replacements as separate cash-flow items. Financing changes when capital leaves the business; it doesn’t remove the underlying project cost. Installation scope determines what’s required to integrate the equipment, while maintenance and replacements affect the net savings retained each year.
Run the same annual-savings forecast against both project expenditure and financing cash flows. This makes the payback period meaningful for the investment structure and exposes how operating costs affect return. Keep assumptions consistent across the system’s 15-or-more-year lifespan.
Commercial battery storage ROI
Assess ROI through projected cash flows, not one month’s bill reduction. Model annual savings, grid revenue, capital investment, and system performance across a 10 to 20-year horizon.
- Set the model period and define net system cost. Include installation and capital costs, then subtract applicable incentives from the investment only when the project qualifies. For 2025, the Internal Revenue Service lists a 30% investment tax credit for battery systems paired with solar. Keep incentive assumptions distinct from operating revenue so the calculation shows how each input changes the result.
- Project each year’s savings and revenue separately. Include demand-charge reduction, energy arbitrage, and grid revenue where the operating plan supports them. Over 15 years, that produces £1,200,000 in total returns before subtracting the system’s deployment cost.
- Calculate lifetime ROI using the net investment and total returns across the chosen period. In the example above, a commercial BESS costs £400,000 to deploy and returns £1,200,000 over 15 years. Subtract the £400,000 cost from total returns, divide by that cost, and multiply by 100. The resulting ROI is 200%, with net gains equal to twice the initial investment.
- Stress-test cash flows against operating changes instead of assuming constant output. Battery discharge, tariff spreads, demand peaks, and grid participation can change yearly value. Include degradation: even a 1% drop in round-trip efficiency can destroy lifetime revenue at commercial scale. Model performance over thousands of cycles, and test how reduced efficiency affects savings and revenue throughout the selected horizon.
- Review the result alongside simple payback and annual net cash flow. A positive lifetime ROI can still conceal weak monthly cash flow, delayed returns, or substantial replacement costs. Show the timing of installation expenditure, operating costs, and projected revenue for each year. Then compare the base case with lower savings or revenue assumptions, so decision-makers can see which inputs most affect investment performance.
Assess your commercial battery storage project against its projected costs, savings, and revenue streams.
Foton Energy (Foton Pty Ltd): C&I BESS
Foton Energy (Foton Pty Ltd) offers C&I BESS for businesses assessing whether storage fits their energy strategy. Consider a commercial battery system when your ROI model shows potential value from demand reduction, energy shifting, or onsite energy management, and you’re ready to explore a configuration suited to your facility’s needs.
Bring your load profile, tariff structure, operating priorities, and financial assumptions to the discussion. These inputs connect your economic analysis with the system requirements your site must meet. Foton Energy also offers Residential Storage Systems, Utility-Scale Storage, and Data Centre & Telco Backup for those distinct applications.
To discuss a commercial battery storage project, contact Foton Energy.
Turn Your ROI Model Into a Project Decision
A financial model is useful when it guides a clear next decision. Set the operating priorities your project must serve, then use them to assess whether storage belongs in your energy plan now, later, or not at all. This makes calculating ROI for commercial battery storage more than a spreadsheet exercise: it connects the investment case to how your facility operates and the outcomes it needs.
Foton Energy (Foton Pty Ltd) offers C&I BESS for commercial and industrial applications, alongside Residential Storage Systems and Utility-Scale Storage for different project requirements. If your analysis points to a commercial project, bring your assumptions and priorities to a discussion about the system direction that fits your needs.
Contact Foton Energy to discuss your project and take the next step with confidence.
Frequently Asked Questions
Return on Investment (ROI) Analysis: How Long Until Payback?
Payback occurs when cumulative net savings recover the project’s net investment. Its timing depends on when benefits accrue, not just on an annual average. Model cash flow by billing period if tariffs, operating schedules, or solar output cause seasonal shifts in savings. For example, a facility with savings concentrated in one operating season may reach payback later than an annualised estimate suggests. Compare payback with long-term cash flow, which captures value after the investment is recovered.
The Upfront Investment (CAPEX): Where Does the Money Go?
Capital expenditure covers the equipment and work required to bring a storage project into operation. Include battery hardware, electrical and civil work, interconnection, engineering, commissioning, and controls integration. Separate these initial costs from ongoing expenses such as software, maintenance, and eventual replacement. Also distinguish storage-specific work from facility upgrades that would happen without the battery. This makes the project’s investment case easier to interpret.
How do you calculate ROI for commercial battery storage?
Calculate lifetime ROI by subtracting net system cost from total savings and revenue, dividing by net system cost, then multiplying by 100. Reduce projected benefits by operating and replacement costs, and account for incentives only when the project qualifies. For uneven annual savings, add each year’s net cash flow across the evaluation period. Use expected usable output and dispatch, rather than battery nameplate capacity alone, to estimate value.
What costs should be included in a commercial battery storage project?
Include equipment, engineering, site preparation, electrical integration, interconnection, installation, and commissioning in project costs. Add financing charges, controls or software expenses, routine maintenance, and planned component replacement to the cash-flow model. If the project includes solar or other facility upgrades, separate those costs from storage-related expenditure. This lets you compare the battery’s contribution with the full investment and avoid assigning unrelated facility expenses to storage.
What are typical commercial battery storage system costs per kWh in the US?
There isn’t one per-kWh figure that applies to every US commercial project. For a useful comparison, divide the installed project cost by usable energy capacity, and keep the system’s power rating distinct from its kWh rating. Installation scope, site work, interconnection, controls, and system duration all affect the result. Compare projects with equivalent scope rather than treating a hardware-only figure as the full installed cost.
How can demand charge savings affect battery storage ROI?
Demand-charge savings can improve ROI by reducing recurring utility charges, even if total electricity consumption stays similar. Estimate the billed peak reduction using the tariff’s demand rate and measurement interval. Then assess whether another facility load could create a higher peak during that billing period. A battery creates demand-charge value only when its discharge lowers the maximum the utility uses to calculate the charge.
How do time-of-use rates and energy arbitrage improve battery storage payback?
Time-of-use rates create arbitrage value when storage charges during lower-price periods and discharges during higher-price periods. Estimate the net benefit after charging losses and operating costs. Then set dispatch priorities: the same stored energy cannot be fully allocated to both arbitrage and peak reduction at once. Model the facility’s actual tariff windows and load schedule to show which use contributes more in each period.
What incentives and tax credits are available for commercial battery storage in the US?
For 2025, the Internal Revenue Service lists a 30% investment tax credit for battery systems paired with solar. A 30% investment tax credit is also listed for qualifying standalone battery systems charged primarily from renewable energy in the United States. Include an incentive in the project model only when the system configuration and eligibility criteria fit. Keep incentives separate from operating savings and revenue when comparing project cash flows.


