

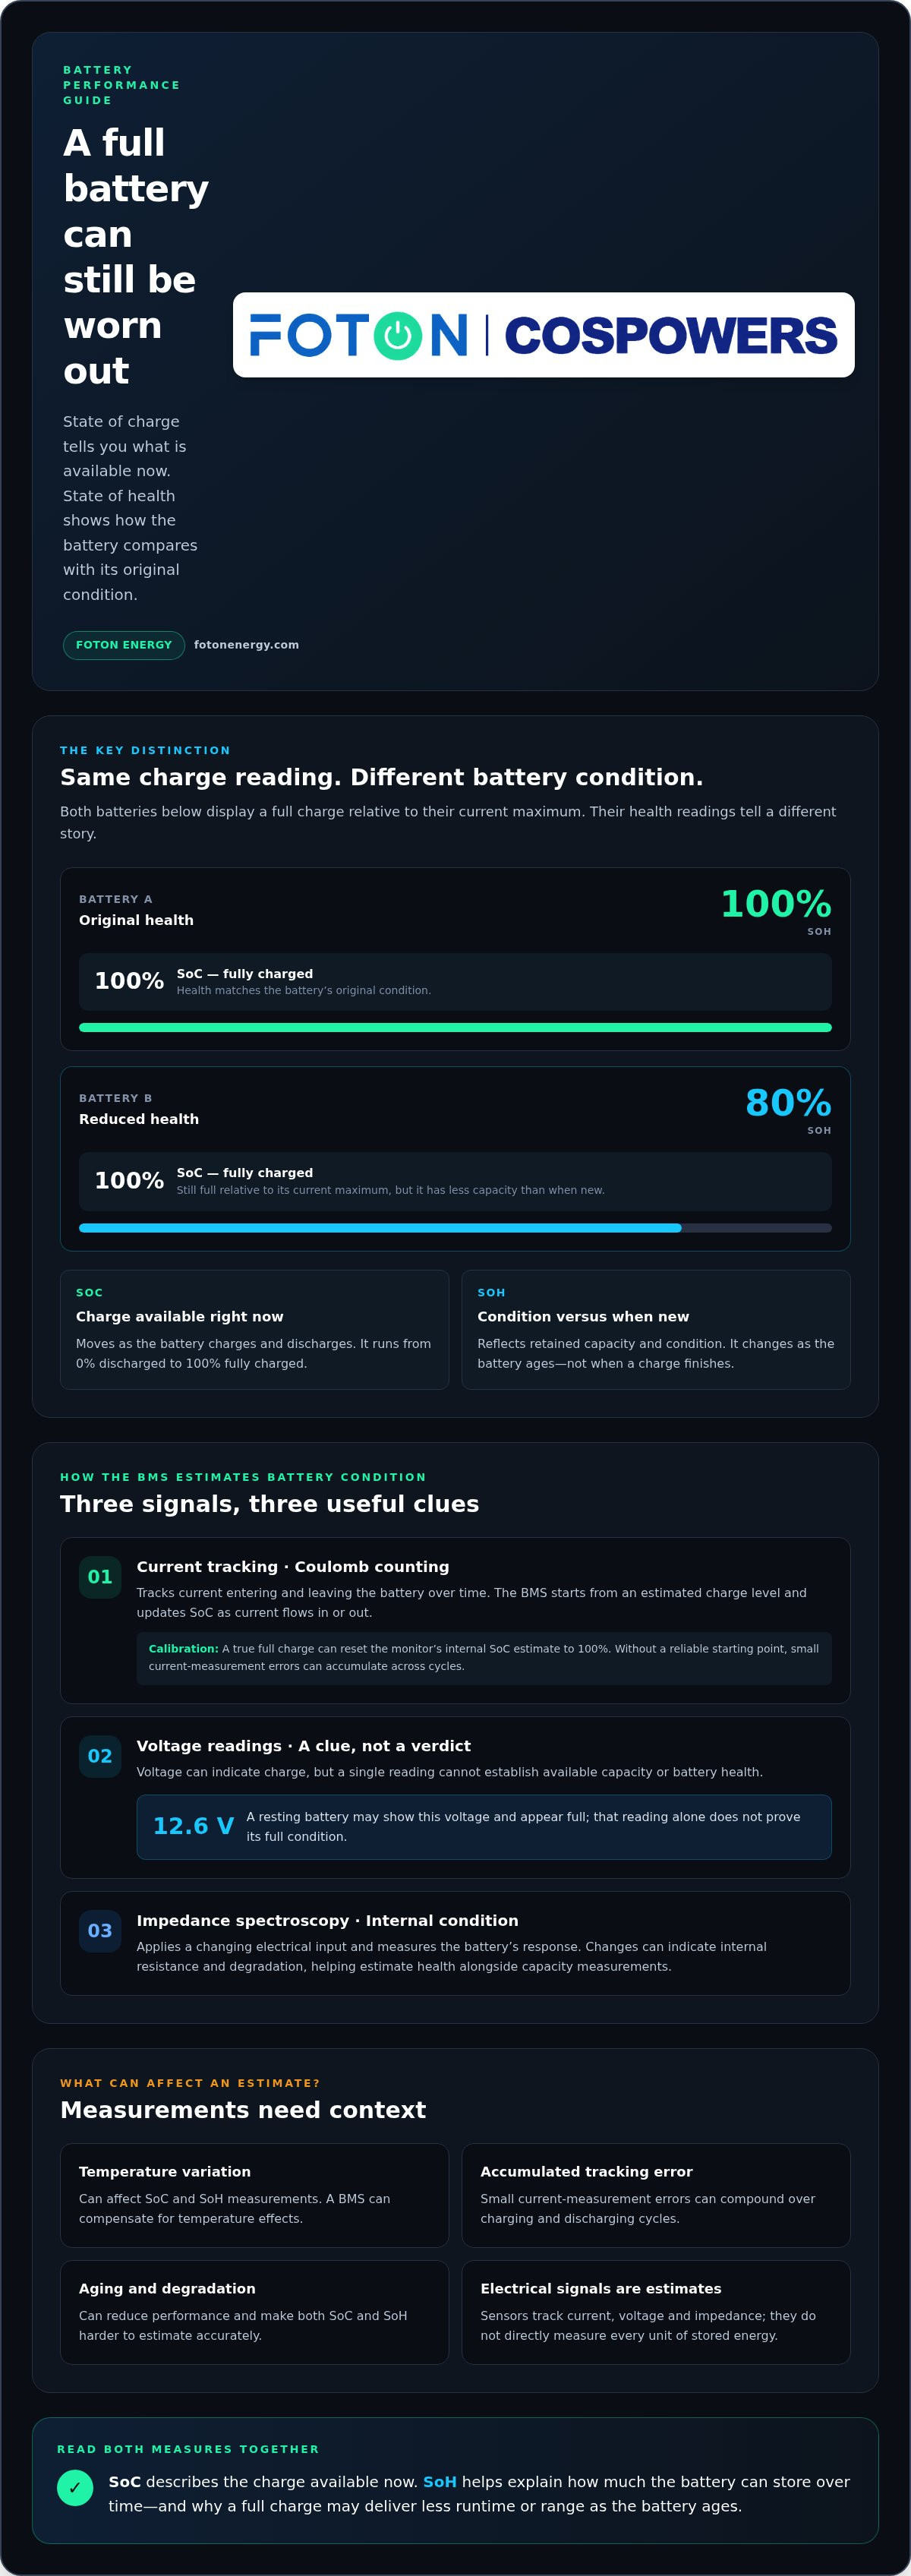
A full battery can still be a worn-out battery. Understanding state of charge vs state of health starts with separating how much energy is available now from how much capacity the battery retains over time. State of charge (SoC) runs from 0% when discharged to 100% when fully charged; state of health (SoH) compares the battery’s condition with its original capacity and performance.
It’s easy to read a high charge percentage as proof that a battery is in good condition. But a battery with reduced health may reach 100% SoC while storing less energy than it did when new, which can mean less runtime or range.
This guide explains what each measure tells you, why estimates can differ, and how batteries use current, voltage and impedance to calculate them. You’ll also learn how temperature and aging affect estimates, and why reading SoC and SoH together gives a clearer picture of battery performance.
Key Takeaways
- Read state of charge as the battery’s current energy level, and state of health as how its capacity compares with its original condition.
- Use coulomb counting to track charge entering and leaving the battery, while remembering that accumulated estimation errors can affect the result.
- Interpret voltage in context: a resting battery may show 12.6 V even when that reading alone doesn’t establish its full condition.
- Impedance measurements can help reveal battery aging, while temperature and degradation can complicate both charge and health estimates.
- Combine the measures for a more useful view: charge indicates what’s available now, while health helps explain how much the battery can store over time.
Coulomb counting, voltage-based estimates, and impedance spectroscopy
A battery management system (BMS) estimates state of charge (SoC) and state of health (SoH) using different signals. Current tracking, voltage readings and impedance measurements each reveal part of the battery’s condition.
Coulomb counting tracks current flowing into and out of a battery over time. The BMS starts from an estimated charge level, then adds or subtracts measured current to update SoC. A true full charge lets a battery monitor reset its internal SoC estimate to 100%, correcting accumulated tracking error. Without a reliable starting point, small current-measurement errors can compound across charging and discharging cycles.
Voltage-based estimates use battery voltage as an indicator of charge, but a single reading can mislead. For example, 12.6 V may appear full when a battery is resting, yet voltage alone doesn’t establish available capacity or SoH. Impedance spectroscopy adds another signal: it applies a changing electrical input and measures the battery’s response. Changes in that response can indicate internal resistance and degradation, helping estimate health alongside capacity measurements.
Battery Management System Estimation
A BMS combines battery measurements with estimation algorithms to calculate SoC and SoH over operation. Calibration aligns the estimate with a known reference, such as a true full charge that resets SoC to 100%. This matters because the BMS uses its estimates to manage charging and discharging; calibration helps limit drift, while algorithms can account for changing operating conditions and measured battery behavior.
Estimation Challenges
Estimation is challenging because voltage, current and impedance respond to more than charge level or aging alone. Temperature variations affect SoC and SoH measurements, though a BMS can compensate for temperature effects. SoC remains an estimate because sensors track electrical signals rather than measuring every unit of stored energy directly. Aging can also reduce performance, making both SoC and SoH harder to estimate accurately.
Assessing Battery Health
Battery SoH is estimated by assessing how much charge the battery can store and examining indicators such as impedance. In practice, measured stored charge can be compared with the battery’s original capacity, while changes in impedance provide further evidence of its internal condition. SoH estimates therefore draw on capacity testing and measurements of the battery’s response; SoC, by contrast, describes the charge available at that moment.
What are SoC (state of charge) and SoH (state of health) for a battery?
State of charge (SoC) describes a battery’s current charge, while state of health (SoH) describes its condition compared with when new. A battery can show 100% SoC even as its SoH declines, so the percentages answer different questions.
Charge and Health Differences
SoC is the battery’s present charge level, typically shown as a percentage from 0% empty to 100% full. SoH reflects retained capacity and condition relative to the battery’s original state. The distinction matters because a full charge doesn’t mean the battery can store as much energy as before. At 50% SoC, roughly half of its usable energy has been discharged, but that tells you nothing by itself about capacity lost through aging.
Consider two batteries that both display 100% SoC. One has 100% SoH, while the other has 80% SoH. Both are fully charged relative to their current maximum, but the second has less capacity than it did when new. Its percentage display can look identical, even though its available energy and runtime may differ.
How Charge and Health Interact
SoC and SoH are connected because battery health affects the capacity available at each charge level. SoC indicates how much of the battery’s current usable capacity remains; SoH shows how that capacity compares with its original capacity. In a vehicle, this distinction explains why a full charge may provide less driving range as the battery ages, even if the SoC reading is unchanged.
Think of SoH as the size of the available energy reserve and SoC as how full that reserve is. A battery with reduced health can still charge to 100% of its reduced capacity. Reading both measures together gives a fuller picture: SoC describes immediate charge, while SoH helps explain the battery’s longer-term ability to store energy.
Changes Over Time
SoC changes as a battery charges and discharges; SoH changes as the battery ages and loses capacity. A phone may move from 100% to 50% SoC during use, then return to 100% after charging. Its SoH, by contrast, does not reset when charging finishes. This difference matters when comparing daily charge levels with gradual changes in runtime.
Battery aging can make the gap more noticeable over time. An electric car at 80% SoH won’t travel as far on a full charge as it did when new, even if its dashboard reads 100% SoC. The charge percentage describes the current state; the health percentage helps explain why that full charge may now deliver less energy.
Definitions of SOC and SOH
State of charge (SoC) and state of health (SoH) describe different aspects of battery capacity. SoC is a snapshot of remaining charge; SoH compares the battery’s present ability to store charge with its original condition. A device showing 100% SoC indicates that the battery is fully charged relative to its current capacity, not necessarily its capacity when new. Understanding state of charge vs state of health starts with identifying which reference each percentage uses.
SoC can be expressed as a percentage: remaining charge divided by maximum charge, multiplied by 100. If a battery holds half of its current maximum charge, its SoC is 50%. For a new battery, maximum charge equals rated capacity. That reference makes the percentage useful for estimating available energy, but it doesn’t measure the battery’s longevity or overall condition.
SoH estimates how much capacity remains compared with the battery’s original capacity. For example, a battery that now delivers 800 mAh from an original 1,000 mAh has 80% SoH. That percentage indicates capacity retention, not charge remaining at the moment. A fully charged battery with reduced SoH can still display 100% SoC because its charge is measured against its present maximum. This distinction makes understanding state of charge vs state of health valuable when a device’s runtime changes despite a full-charge display.
What SoH level means a battery needs replacement? A typical replacement threshold is 70-80% SoH, while the suggested threshold for a car battery is below 60%. These are different reference points, not universal instructions for every battery. The battery’s role, required runtime, and consequences of reduced performance affect how its SoH percentage should be interpreted.
For a phone, reduced capacity may mean less time between charges; for a vehicle, it may mean less range at full charge. In both cases, SoH helps explain declining performance, while SoC shows the current charge level. The practical effect of the same SoH can vary between devices, depending on their energy demand and required operating time.
Treat the readings as complementary indicators. High SoC with lower SoH means the battery is charged, but its storage capacity has declined. Low SoC with stronger SoH means it needs charging, while its capacity remains closer to its original condition. Tracking each percentage separately helps distinguish temporary discharge from gradual capacity loss, supporting clearer decisions about use and battery longevity.
SOC and SOH calculation examples
Use capacity ratios to assess charge and health, keeping their reference points separate. SoC compares the remaining charge with the battery’s current maximum capacity. SoH compares its present full capacity with its original capacity. The arithmetic is simple; choosing the right capacity for each comparison makes the result meaningful.
For SoC, divide the remaining charge by current maximum capacity, then multiply by 100. A battery holding 1,500 mAh out of a current maximum of 3,000 mAh has 50% SoC. The calculation says half of that battery’s present capacity remains. It doesn’t say the battery still stores as much energy as when new.
For SoH, compare the battery’s present full capacity with its original capacity. If capacity has declined from 3,000 mAh to 2,400 mAh, calculate 2,400 divided by 3,000, then multiply by 100. The result is 80% SoH. This measure reflects capacity degradation, not how much charge remains during a particular use.
A phone example shows why both readings matter. A new phone at 50% SoC and 100% SoH might provide five hours of use. A two-year-old phone at 50% SoC and 70% SoH might provide 3.5 hours. The same charge percentage can therefore correspond to different runtime when retained capacity differs.
A modeled winter example illustrates the practical effect for a jump starter. At 15°F, a unit at 80% SoH provides approximately seven successful starts for a 6.2 L V8 truck. At 70% SoH, the model estimates approximately six starts. These figures belong to that scenario; they show how reduced health can change useful output.
How can I check SoC and SoH on a car, phone, or battery system? Read SoC on the vehicle display, phone battery screen or system monitor. For SoH, use the device’s battery-health display or the battery management system’s capacity estimate, where available.
Interpret estimates in light of operating conditions. Temperature variations can affect SoC and SoH measurements, though a battery management system can compensate for temperature effects. Charge cycles and aging also change capacity, so a stored estimate may not reflect performance in every condition. Compare readings taken under similar conditions to make trends more useful.
For a useful comparison, record the SoC reading, SoH estimate and measurement conditions together. For example, note whether a vehicle battery reading was taken after charging or after use. A series of readings taken consistently can show whether charge is changing temporarily or capacity is declining through degradation.
Coulomb counting
Coulomb counting estimates battery charge by tracking current over time. During operation, a battery monitor measures the current entering or leaving the battery, then adds or subtracts that charge from its estimate. The method applies to electric vehicles, portable devices and stationary storage systems. Its strength is continuous tracking, rather than reliance on a single voltage reading.
In practice, the calculation needs a starting estimate and consistent current measurements. When charging adds charge, the estimate rises; when discharge removes charge, it falls. A monitor can compare accumulated current with the battery’s usable capacity to update its displayed SoC. A full charge can provide a useful reference point for resetting the estimate.
Current tracking has limitations. Measurement errors can accumulate over repeated charge cycles, especially if the starting point is inaccurate. Capacity also changes as the battery ages, making estimates based on its original rating less representative over time. Temperature variations can affect measurements, and battery management systems can compensate for temperature effects when estimating charge.
Discharge rate matters too. Peukert’s relationship accounts for how available capacity changes with discharge current, particularly in lead-acid batteries. Typical Peukert values are 1.2 to 1.6 for flooded lead-acid batteries, 1.1 to 1.25 for gel batteries, and 1.01 to 1.05 for lithium batteries. These ranges show why one fixed current-to-capacity assumption won’t suit every chemistry.
That difference matters when comparing battery life across applications. A lead-acid battery supplying a heavier load can deliver a different usable capacity than its rating suggests, while lithium’s listed Peukert range is closer to 1. For an electric vehicle or storage system, the battery management system must interpret current alongside capacity, chemistry, and operating conditions. The resulting SoC remains an estimate, not a direct count of stored energy.
For reliable tracking, compare the displayed estimate with known operating events, such as a full charge followed by measured discharge. A clear reference can reveal drift and help distinguish an estimate issue from gradual degradation. In a stationary system, consistent monitoring across normal operation also helps interpret charge changes against actual use. For battery storage planning, explore storage system options suited to your application.
Foton Energy (Foton Pty Ltd): C&I BESS
Foton Energy (Foton Pty Ltd) offers C&I BESS for commercial and industrial energy storage projects. Understanding SoC and SoH helps project teams distinguish the energy available now from the capacity the battery has retained, both relevant when assessing a storage system’s operation over time.
For organisations evaluating energy storage alongside residential systems, utility-scale storage, or data centre and telco backup, Foton Energy’s offerings span those application areas. C&I BESS is the relevant next step when the project involves commercial or industrial storage requirements; the appropriate system depends on the project’s operating needs and design.
Contact Foton Energy to discuss your energy storage project.
Make battery insight part of your next decision
Battery monitoring is most valuable when it informs an operating decision. For an energy storage project, define what the system needs to support, how its performance will be assessed, and how battery data will guide future operating choices. Aligning these considerations early can help teams make clearer comparisons as requirements evolve.
Understanding state of charge vs state of health is one part of that planning. The next step is to connect battery performance measures with the demands of your application, whether you’re assessing commercial and industrial storage or another energy storage project. Foton Energy (Foton Pty Ltd) works across C&I BESS, Residential Storage Systems and Utility-Scale Storage.
Bring your project requirements into the conversation and explore an approach suited to your needs. Contact Foton Energy to discuss your energy storage plans and take the next step with confidence.
Frequently Asked Questions
What is battery state of charge (SoC)?
Battery state of charge (SoC) is the estimated charge remaining, expressed as a percentage. It helps show how much energy is available for a device or system’s next operating period. For example, a phone’s battery display is an SoC estimate, while a storage system monitor can show charge changing as energy flows in or out. The reading helps with operational planning; it does not directly measure battery age.
What is battery state of health (SoH)?
Battery state of health (SoH) estimates how the battery’s present capacity compares with its original capacity. An example: if a battery originally stored 1,000 mAh and now stores 800 mAh, its SoH is 80%. This provides an indication of capacity retention, not immediate charge. A declining SoH can help explain why a device needs charging sooner, even if its charge display reaches full.
How do SoC and SoH differ?
SoC describes the battery’s charge at a particular time; SoH reflects the capacity it has retained as it ages. For instance, a device can show a full charge while its reduced capacity limits how long it runs. SoC matters for immediate use, while SoH helps assess longer-term capability. Reading both makes battery performance easier to understand than relying on a charge display alone.
How is battery state of charge measured or calculated?
Battery SoC is estimated from measurements such as current and voltage. Coulomb counting tracks current entering and leaving over time; voltage-based methods compare measured voltage with expected battery behaviour. Constant-current testing can also help determine charge. A battery monitor combines these signals with its stored capacity assumptions, so readings can vary with battery chemistry, operating conditions and calibration.
What do battery SoC and SoH percentages mean?
SoC percentages show estimated charge relative to the battery’s current maximum: 0% represents discharged, and 100% represents fully charged. SoH percentages compare current capacity with original capacity. For example, 80% SoH means the battery retains 80% of its original capacity estimate. The denominator matters: 100% SoC does not mean 100% SoH, and the two readings describe different operating information.
How do temperature, age, and usage affect SoC and SoH?
Temperature can influence battery measurements, so a battery management system may compensate for temperature effects when estimating SoC and SoH. Age-related degradation reduces performance and can make both estimates more difficult. Usage matters too: charging and discharging alter SoC, while repeated operation contributes to changes in the battery’s condition. Comparing readings taken under similar conditions can make changes easier to interpret.
How do SoC and SoH affect battery range, performance, and lifespan?
SoC affects the energy available for current use, while SoH affects the capacity available even after charging. For electric vehicles, maintaining SoC between 20% and 80% can extend battery life by up to 60%. A reduced SoH can also limit driving range or device runtime at a full charge. The practical effect depends on the application’s energy demand and operating pattern.


